On an American style roulette wheel there are 38 numbered spaces. 18 of these spaces are colored red and 18 of them are colored black, with 2 spaces colored green (“0” and “00”). This means that the probability of the roulette ball landing in a red space is 18/38 or 47.4%.
If you were to bet on the ball landing in a red space, your payout would be 1:1 (i.e. a $100 bet earns you an additional $100 if the ball lands in a red space but you lose your $100 otherwise). You can model the expected value of this bet as follows:
E[Payout for Red] = (Probability of Red)*(Payout Red) + (Probability of Not Red)*(Payout Not Red)
And plugging in the values for a $100 bet, you get:
E[Payout for Red] = (18/38)*(+$100) + (20/38)*(-$100) = -$5.26
For every $100 bet on red you lose $5.26 in expectation.
This is a game of negative expected value. You are expected to lose and The House is expected to win.
Of course, reality never follows expectation. For example, you might get lucky and win 10 times in a row to be up big. But, if you play this game long enough, any such good luck will fade away and you will lose all of your money.
Your loss becomes The House’s gain—their edge. Every glittering light in every casino around the world was built off of this edge repeated millions and millions of times.
Therefore, if you are principally concerned with the act of making money (and not just entertainment), you would never play such a game.
But…what if we made a change to the roulette wheel?
A New Roulette Wheel
For our new roulette wheel we are going to swap out the green spaces (“0” and “00”) for red spaces to have 20 red spaces and 18 black spaces. With this new wheel, the probability of the ball landing on red is 20/38 or 52.6%.
Additionally, the payouts for this new game will be significantly reduced. So instead of losing your entire bet if the ball lands on a black space, you now only lose 1% of whatever you wagered. On the flip side, if you land on red and win, you only gain 1% of whatever you wagered.
Therefore, the expected payout for a $100 bet on red for this “new” roulette wheel would be:
E[Payout for Red] = (20/38)*(+1%*$100) + (18/38)*(-1%*$100) = $0.0526
Unlike our last game, this is a game of positive expected value. Every $100 bet on red makes you $0.05, in expectation.
But, it’s not as exciting as Vegas, is it?
Well, guess what? What if I told you that this “new and improved” roulette wheel has created more wealth than every casino in Vegas…combined? How do I know this?
Because this new roulette wheel behaves a lot like the U.S. stock market. In fact, every spin of this new wheel is roughly equivalent, in both probability and in payoff, to investing in the Dow Jones Industrial Average for a single day.
On the probability side, consider how often the Dow has provided a positive return over different holding periods (i.e. 1D = 1 day, 1M = 1 month, 1Y = 1 year, etc.) since 1915:
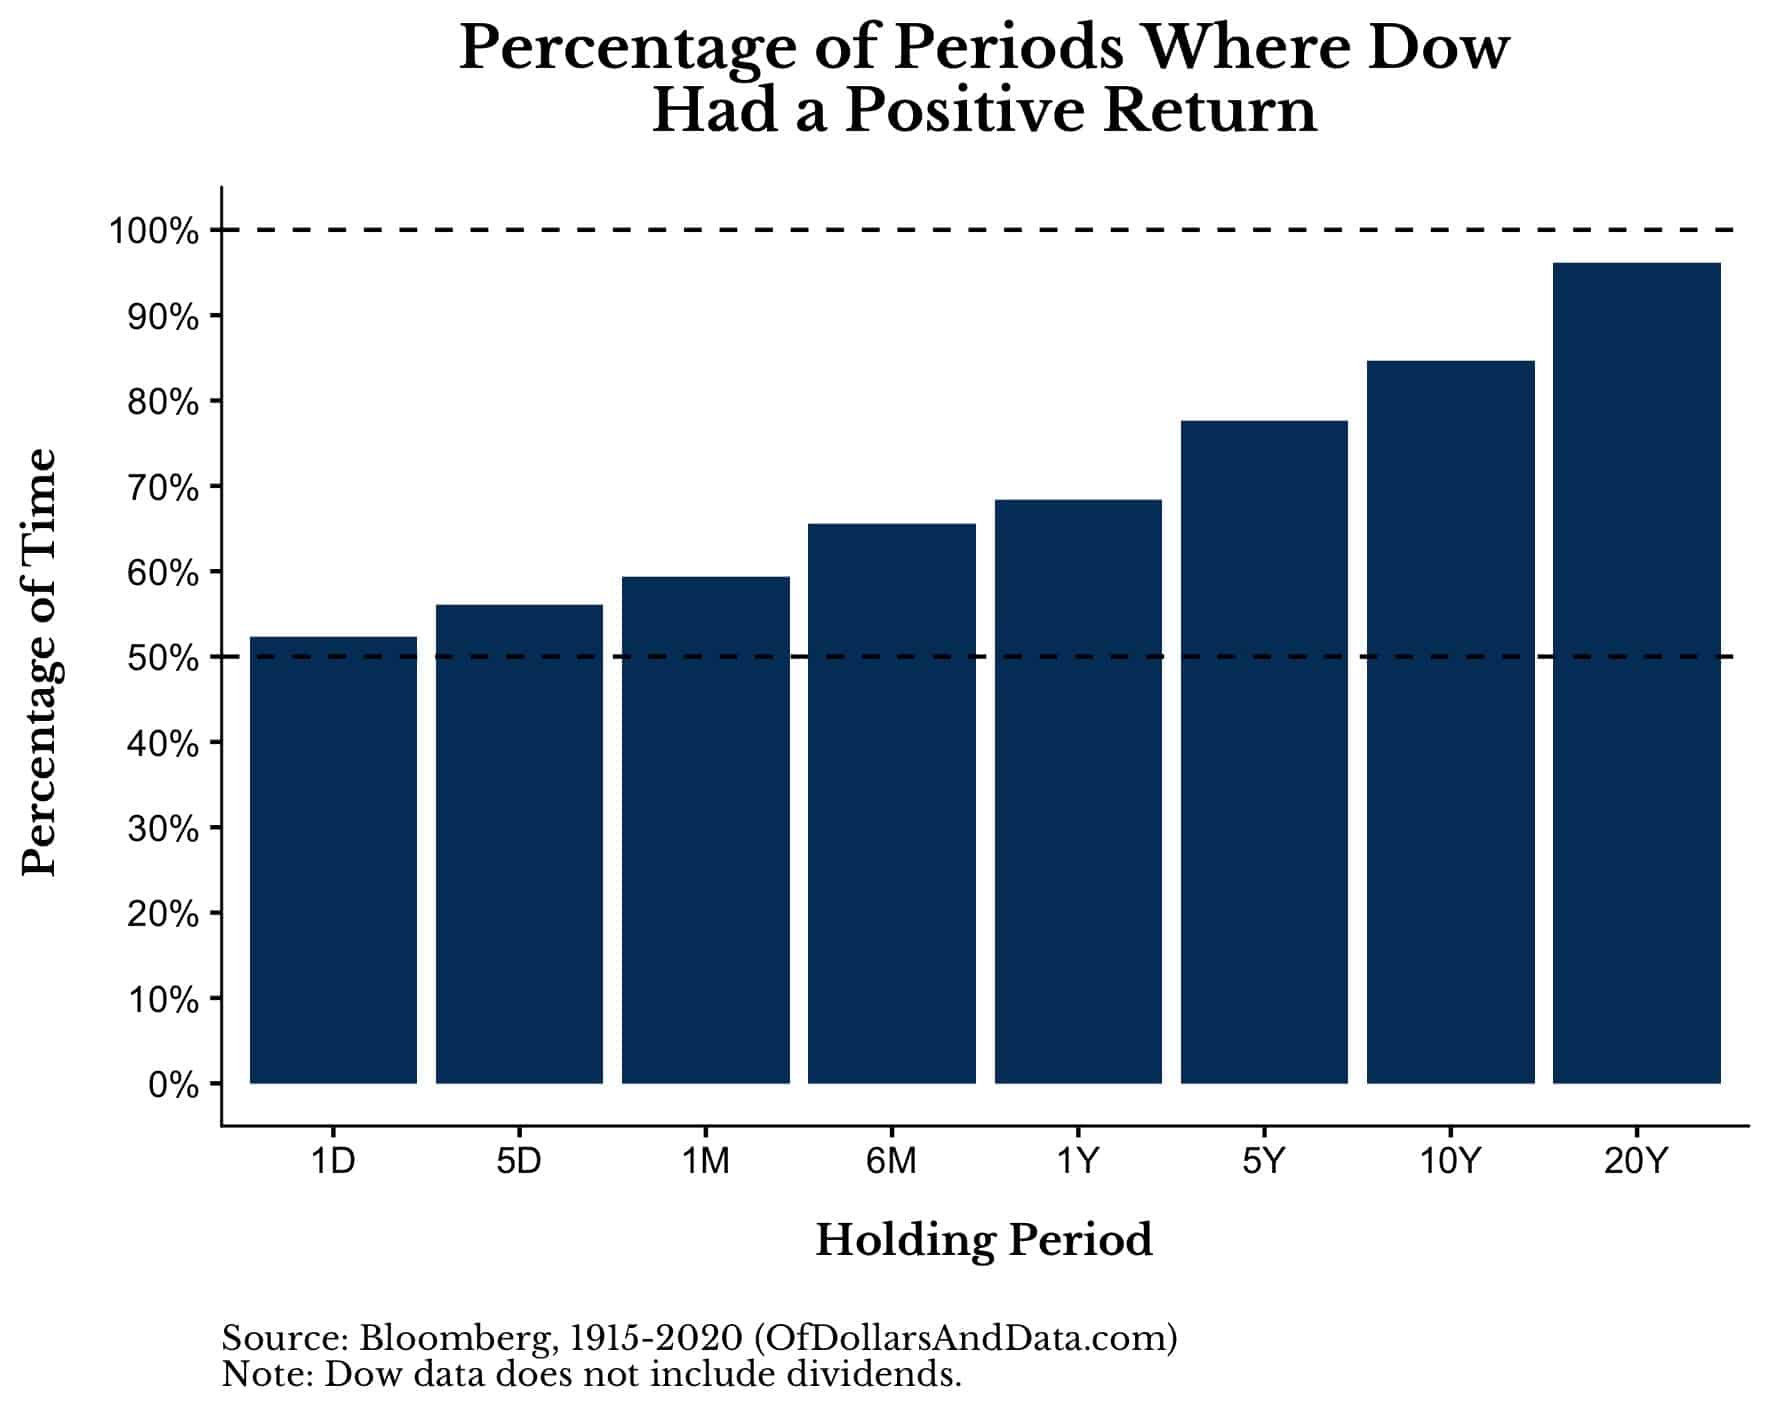
As you can see, over all 1-day (“1D”) periods, the Dow has returned positive roughly 52.3% of the time. This is very similar to the 52.6% (20/38) chance of landing on red for our new roulette wheel.
More importantly though, the Dow (just like our roulette wheel) illustrates that the probability of a positive return converges toward 100% over longer holding periods.
On the payoff side, you can imagine plotting how much the Dow returned, on average, on all up days versus all down days. You could then repeat this exercise for up months vs. down months and up years versus down years.
If we were to plot these payoffs over these holding periods, it would look something like this (Note: I colored the positive periods red to match our bet for red on the roulette wheel):
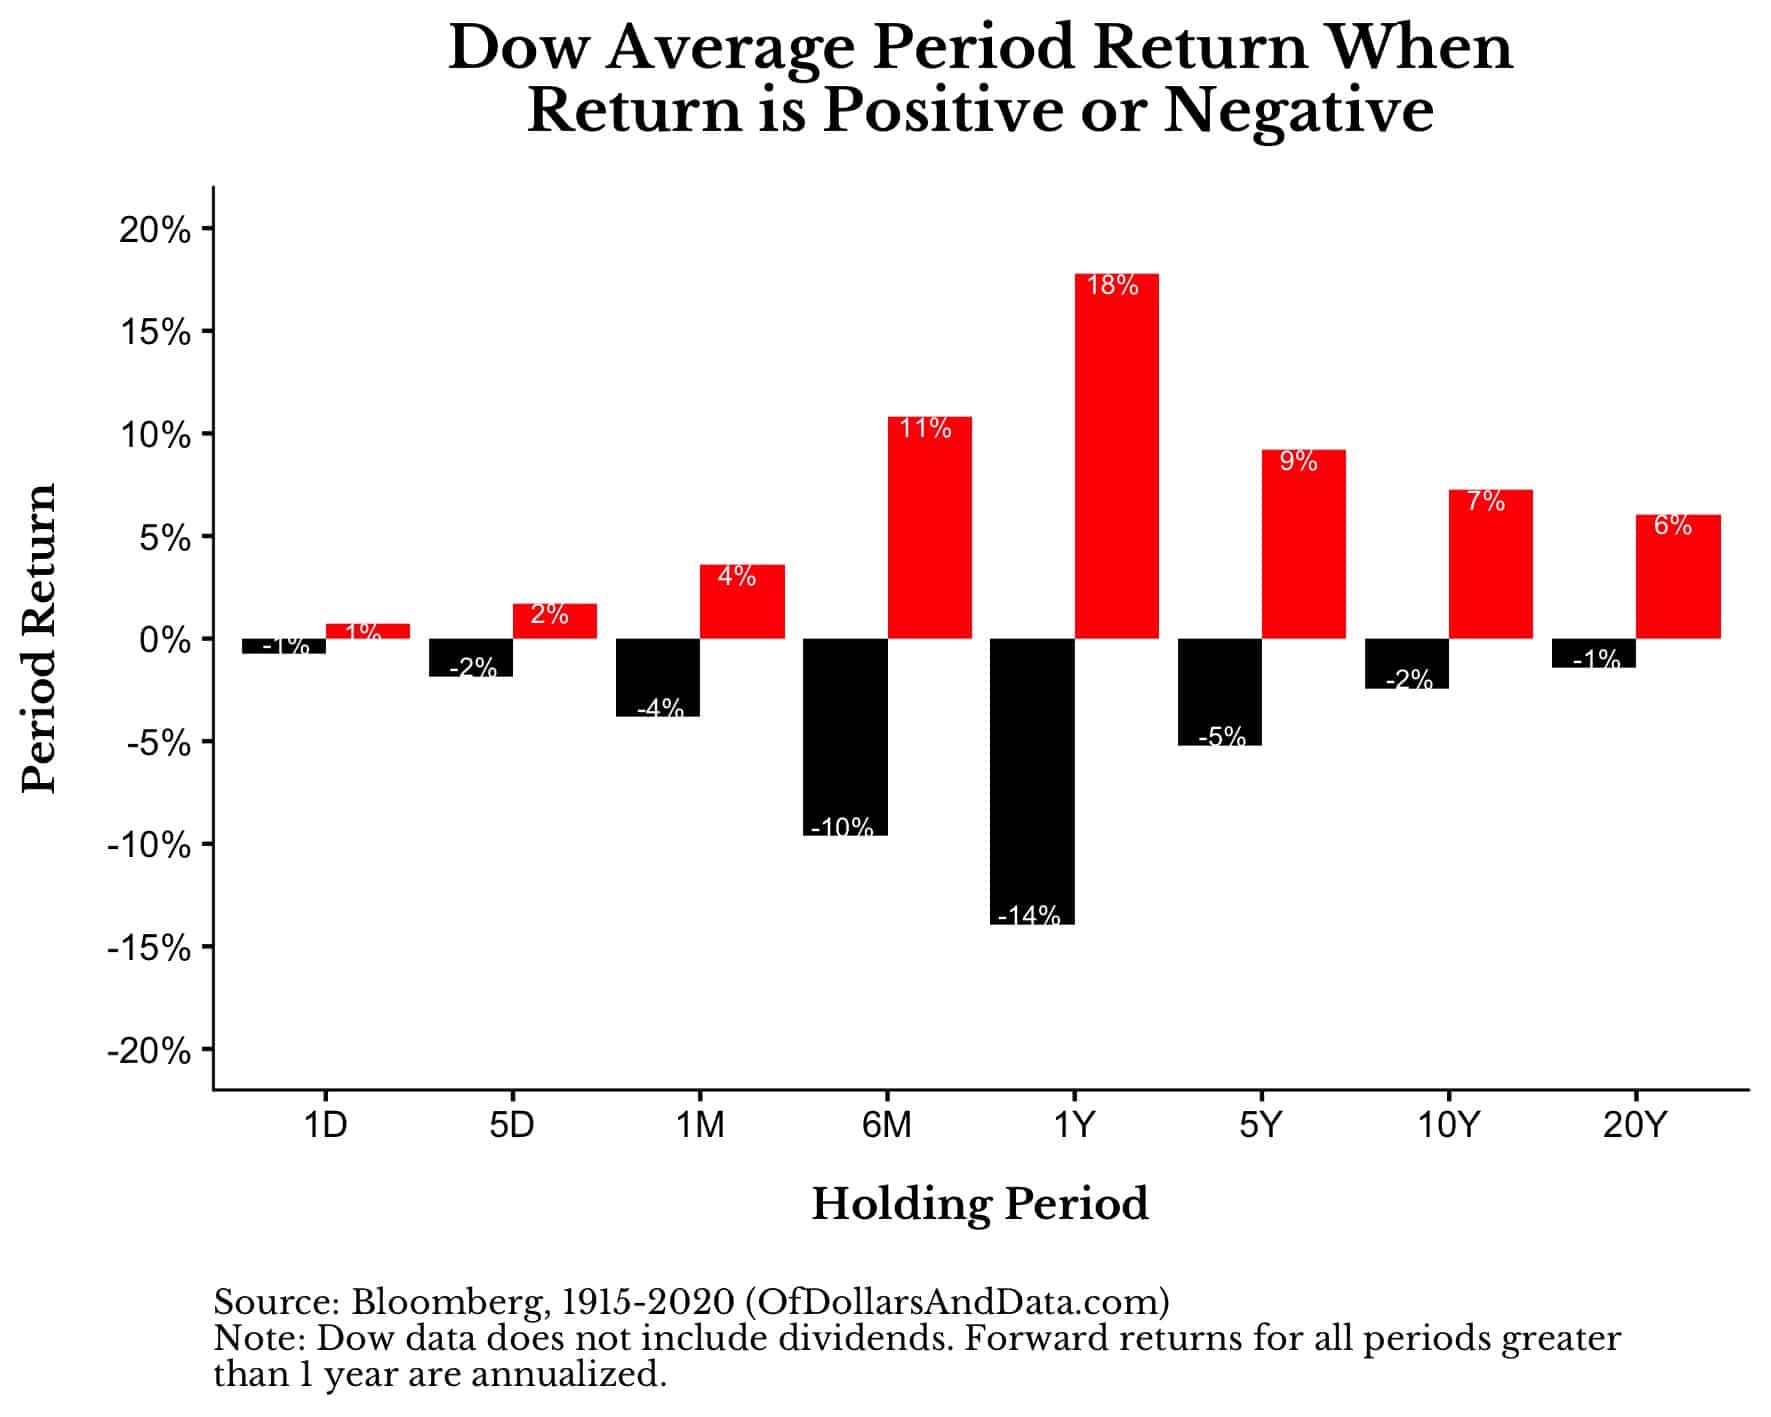
The 1-day positive return is about 1% and the 1-day negative return is about -1% on average (these values are rounded from +0.74% and -0.75% to be precise). And once again, longer holding periods lead to more positive payoffs on average.
For example, over a 20-year holding period, the probability of a positive return in the Dow was 96% with the average positive return being 6% annualized. And this data doesn’t even include dividends.
If we use the Shiller data since 1871, which adjusts for dividends and inflation, the results are slightly more impressive:
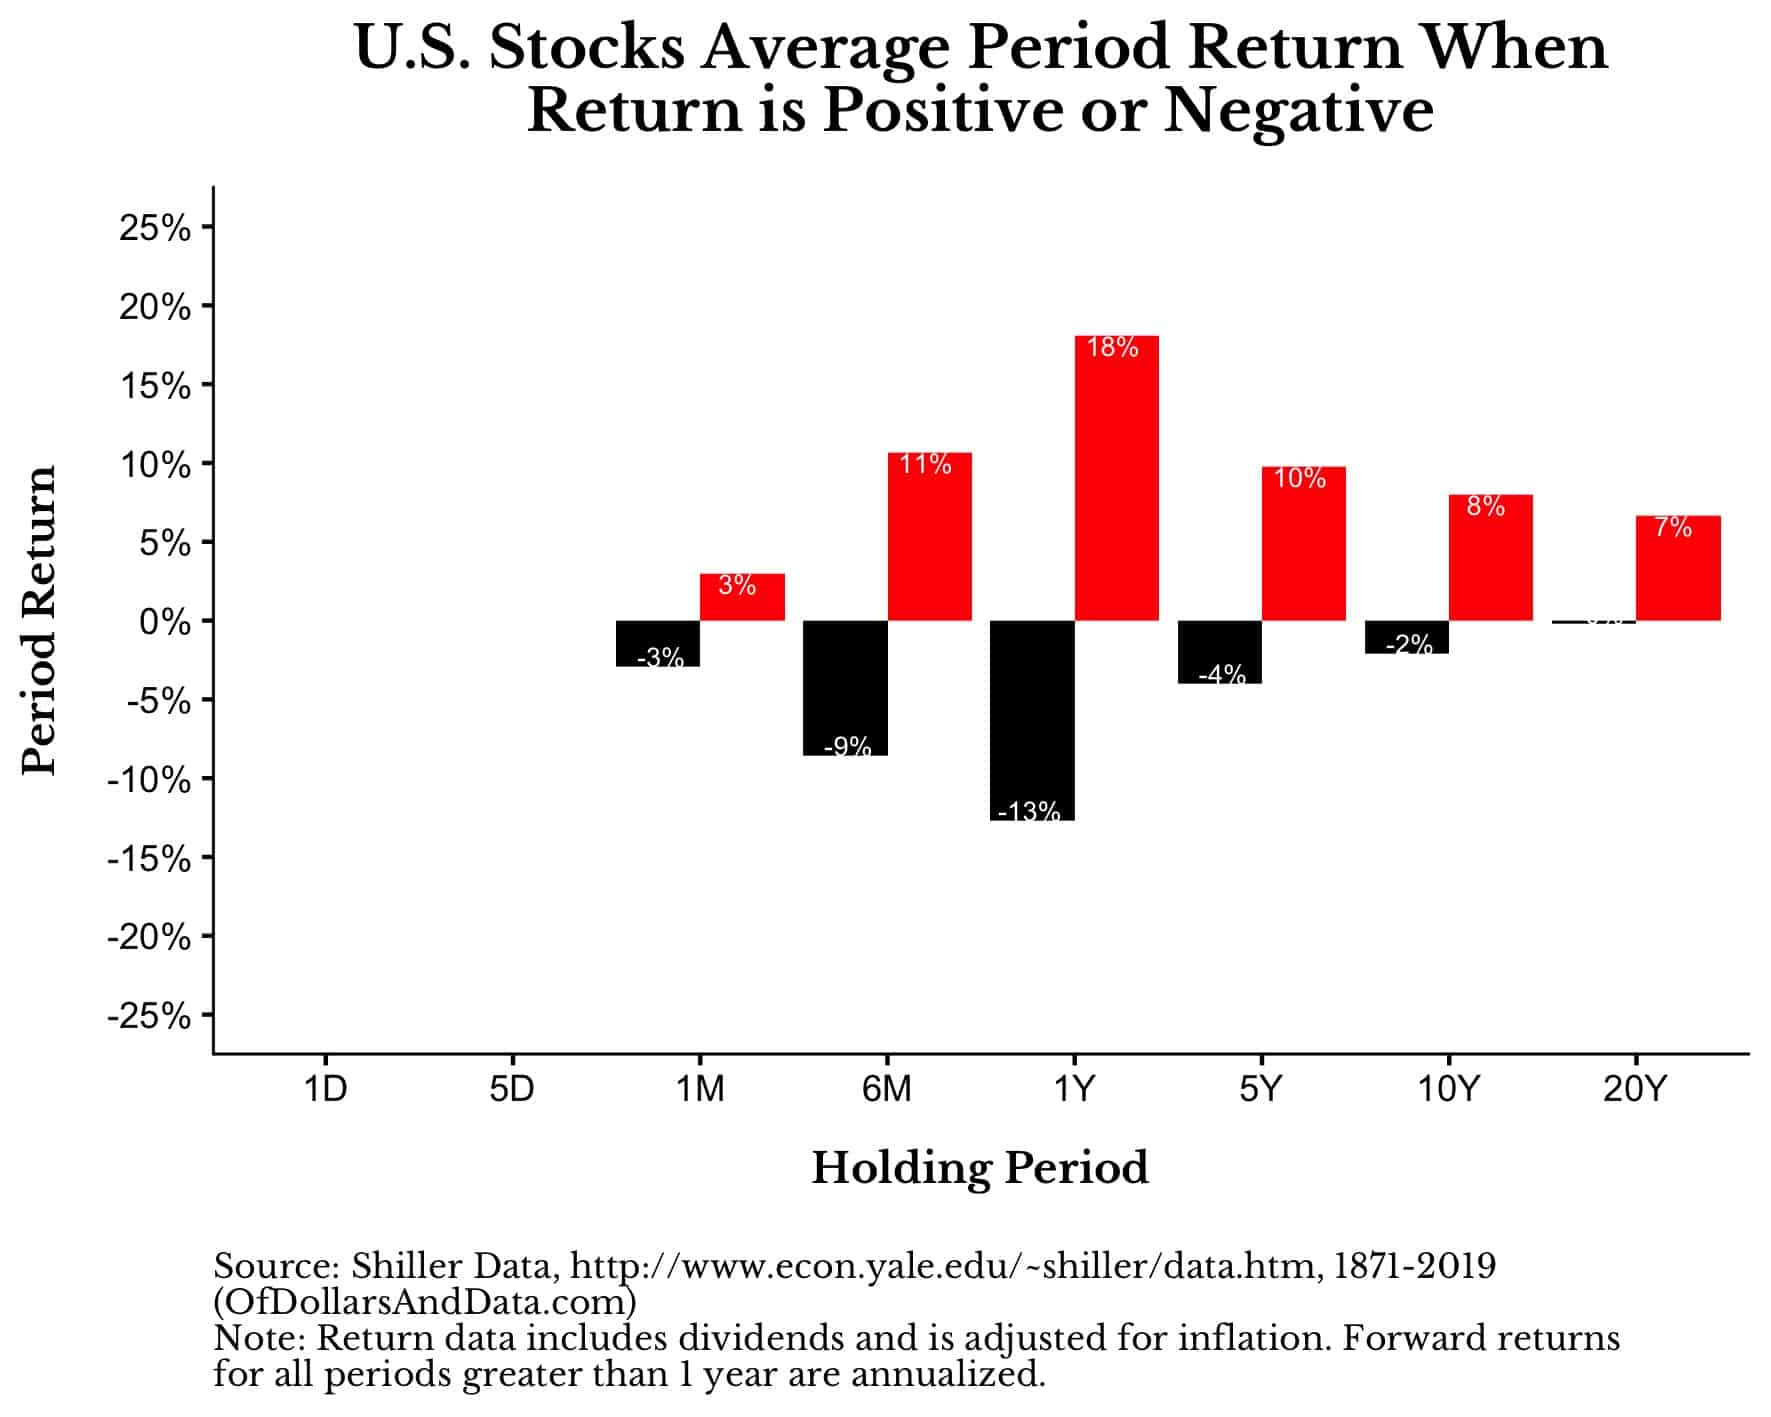
And remember, based on our prior plots, these more positive payoffs are also more likely over longer holding periods. So not only do the payoffs increase, but we are more likely to experience them as well.
Putting this all together, we can see that investing in U.S. stocks day-to-day over the last century has more or less resembled a modified game of roulette where the probability of winning is roughly 52.6% (20/38), the payoff for winning is about 1% of your wager, and the payoff for losing is about -1% of your wager.
Of course, the payoffs in the actual stock market are far more volatile than this simple game. While, on average, you only lose 0.75% on a down day, historically, there have been many days where you would have lost 5% or more. The same thing goes for the upside.
Additionally, using the U.S. stock market is not exactly a fair representation of all global stock markets, given how well the U.S. has done over the prior century. If we looked at a less stellar example, what might we see?
Now Do Japan
Even if we put aside the U.S. stock market and use the stock market that was involved in the greatest asset bubble ever, there are still arguments to be made for investing in stocks.
For example, though the probability of a long-term positive return has not converged toward 100% (like the Dow), since 1970, Japan’s Nikkei index has shown a ~60% chance of being positive over longer holding periods:
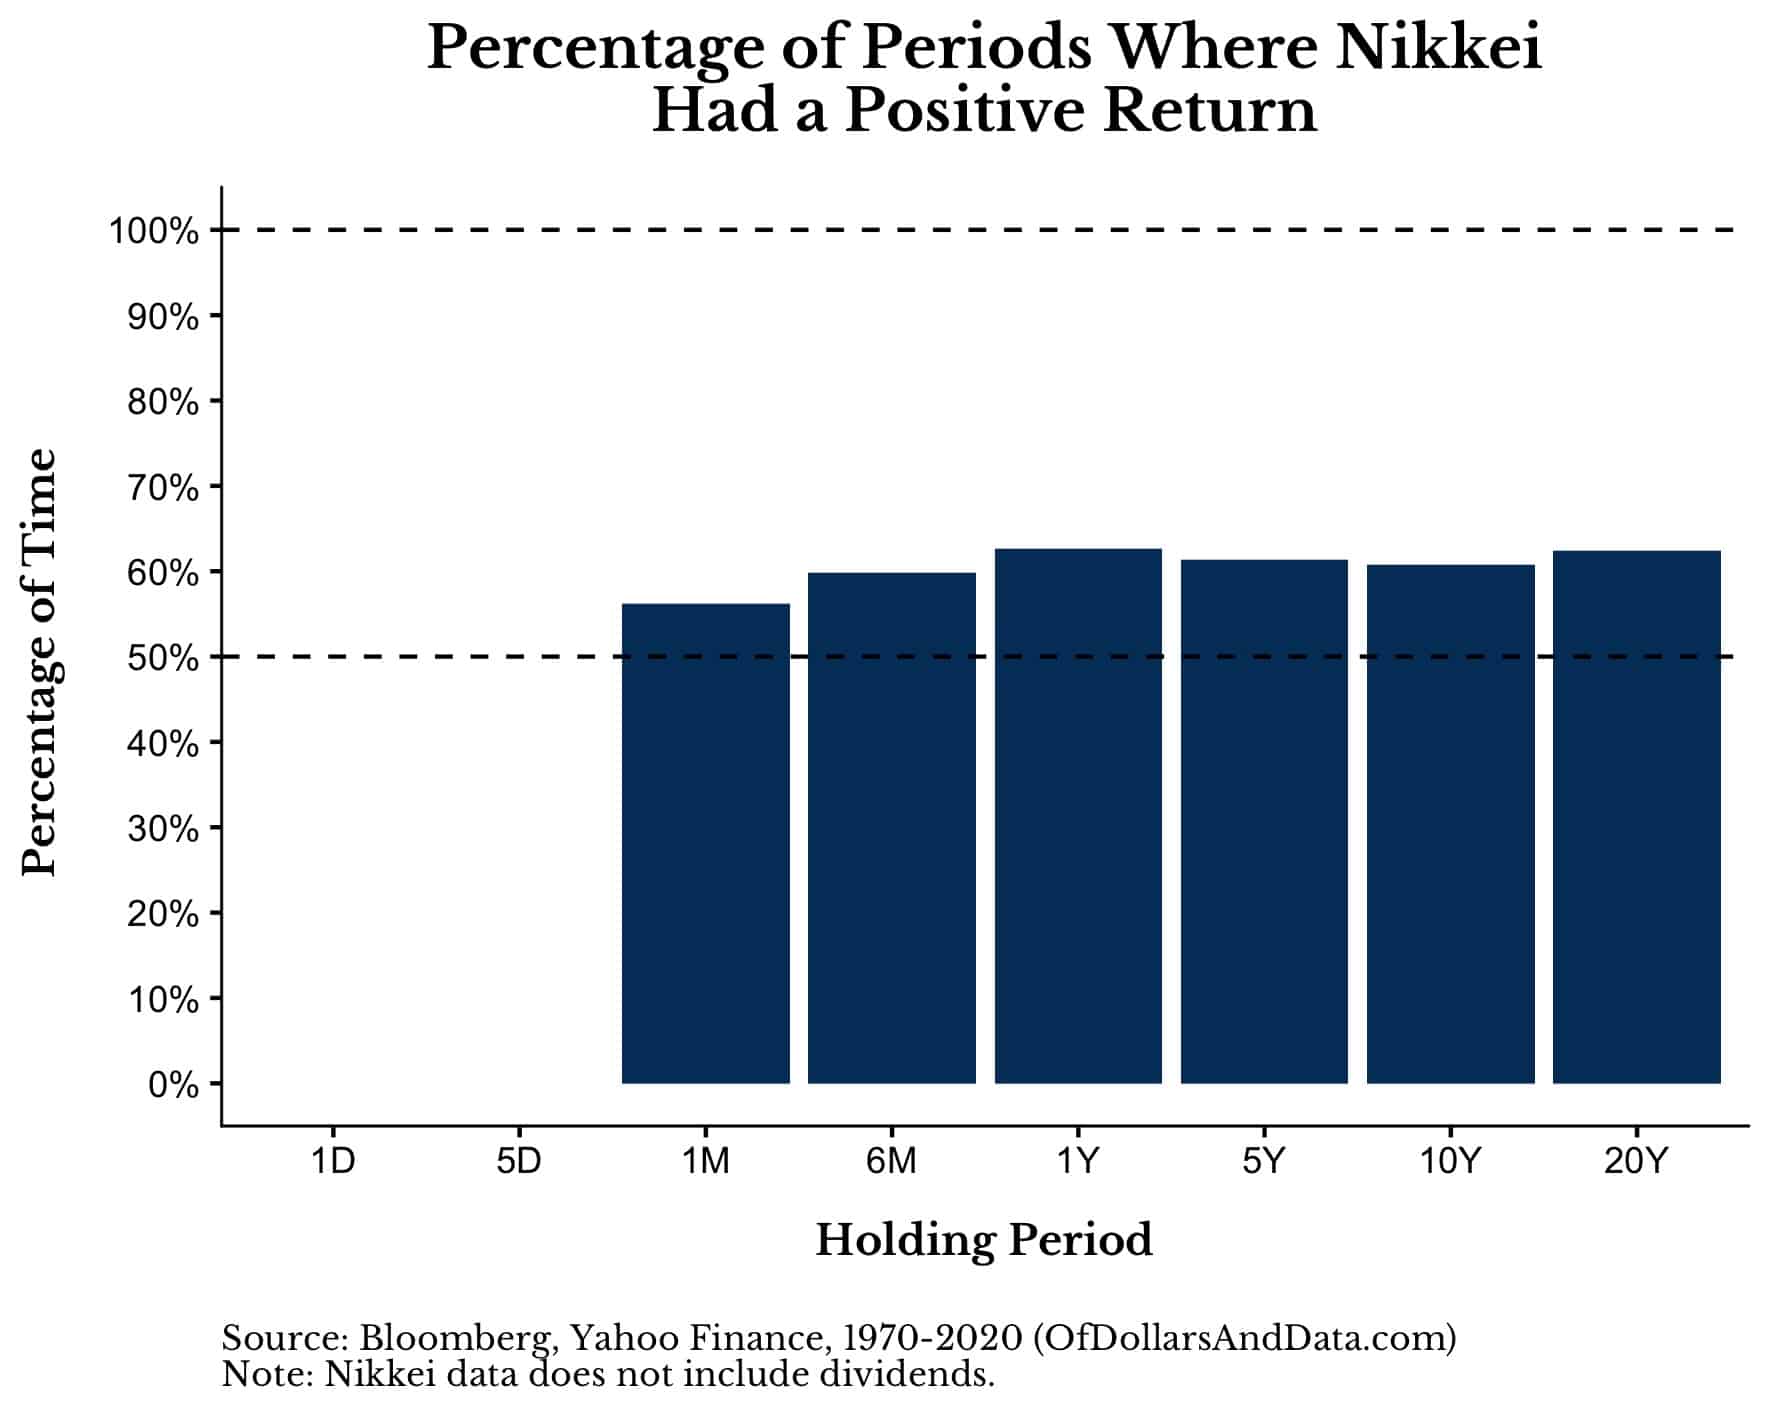
The reason that this chart is so much less impressive than the Dow’s is due to the subpar performance following the late 1980s asset bubble I mentioned above.
As of this writing, Japan has still not surpassed the prices they experienced during this bubble, despite three decades of economic activity.
You can get a fuller picture of this lackluster growth by looking at the average positive and negative returns over different holding periods:
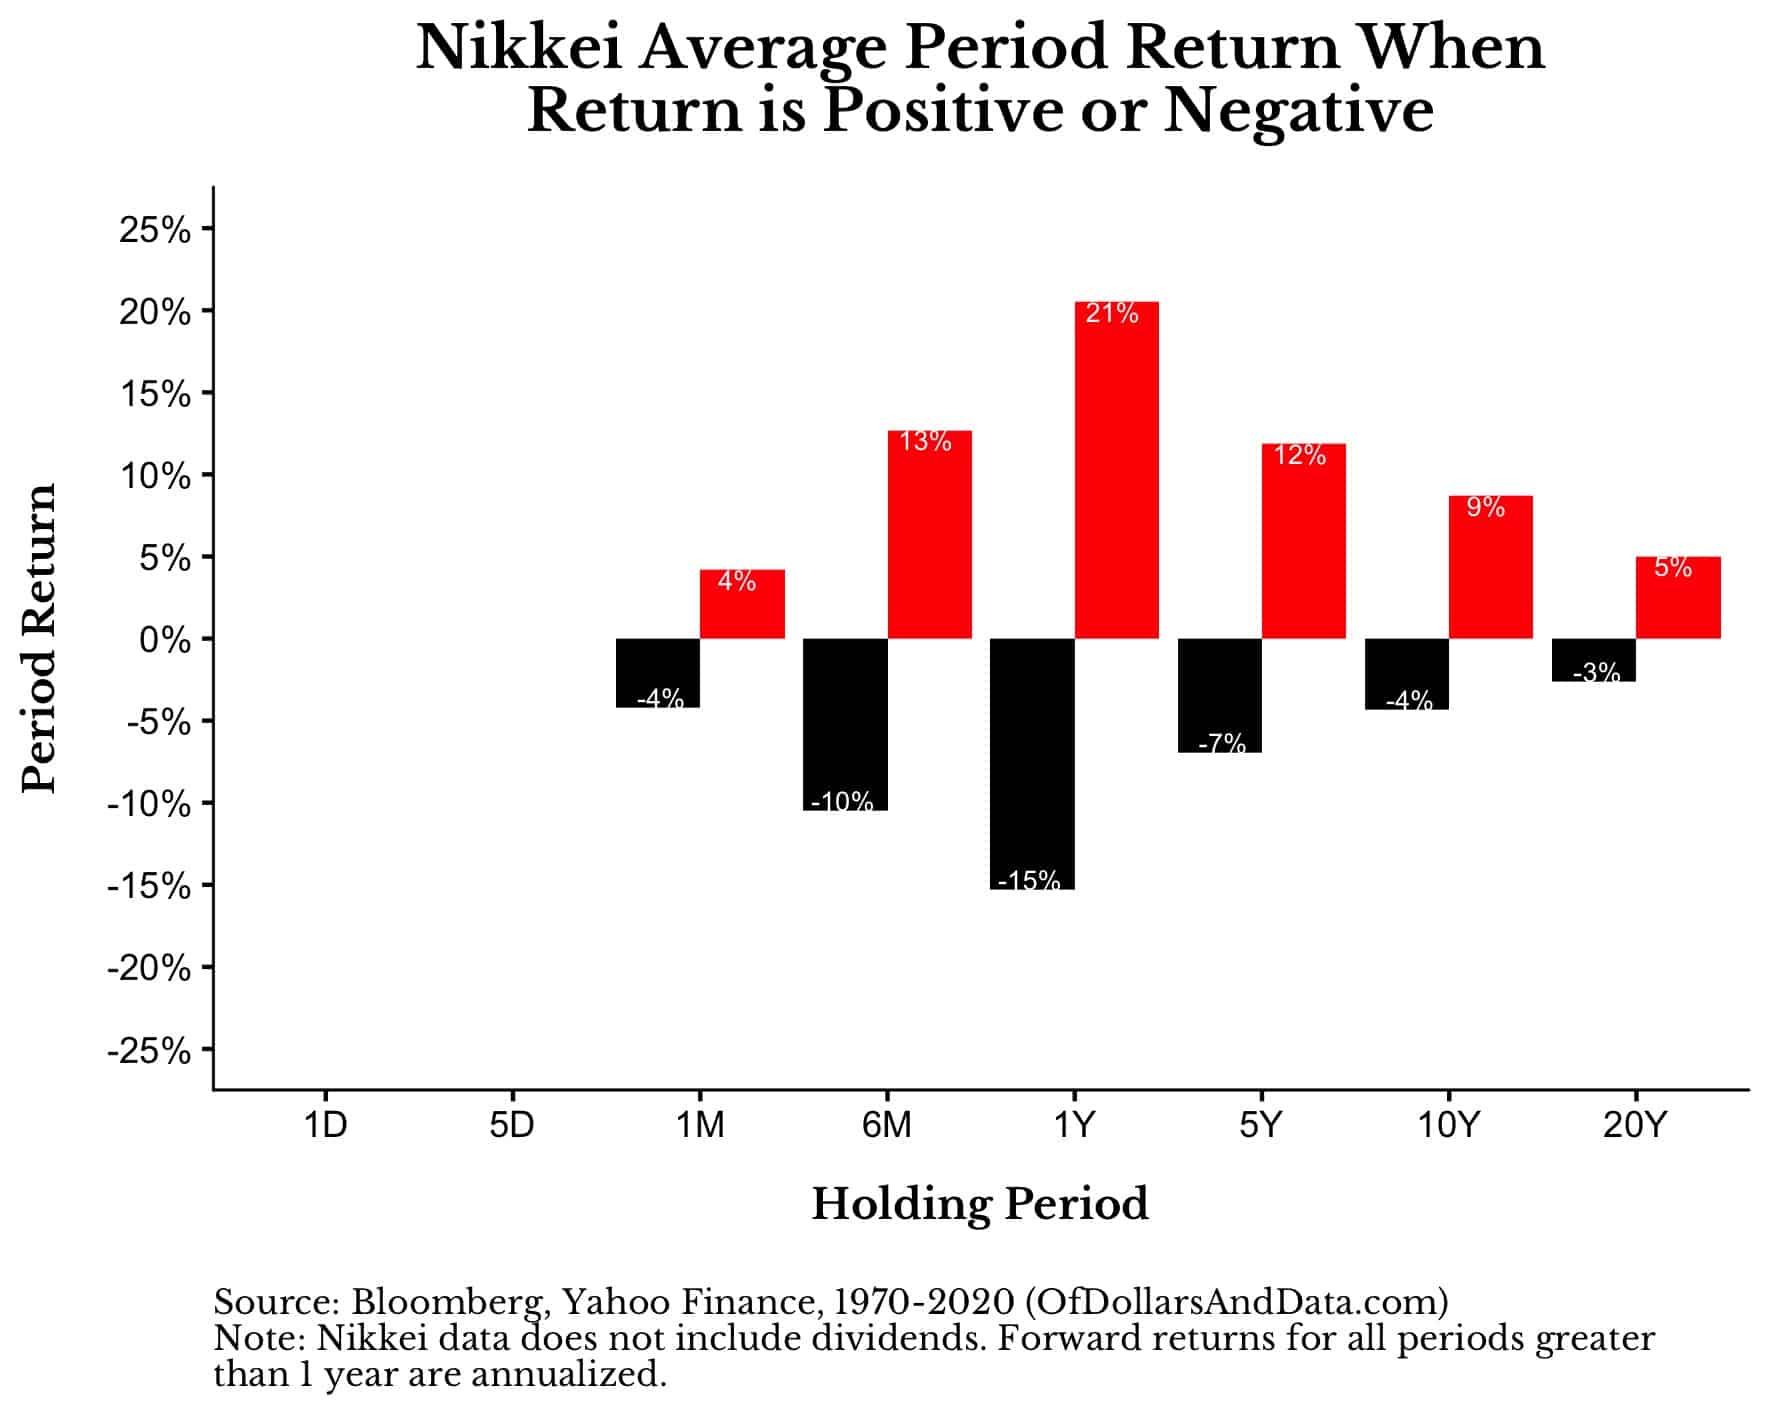
If we take these returns and plot them as a boxplot (i.e. show the 25th, 50th, and 75th percentile returns for each holding period), we can see that Japan has earned a 5% (or greater) annualized return for the majority of its 10-year holding periods for the past five decades:
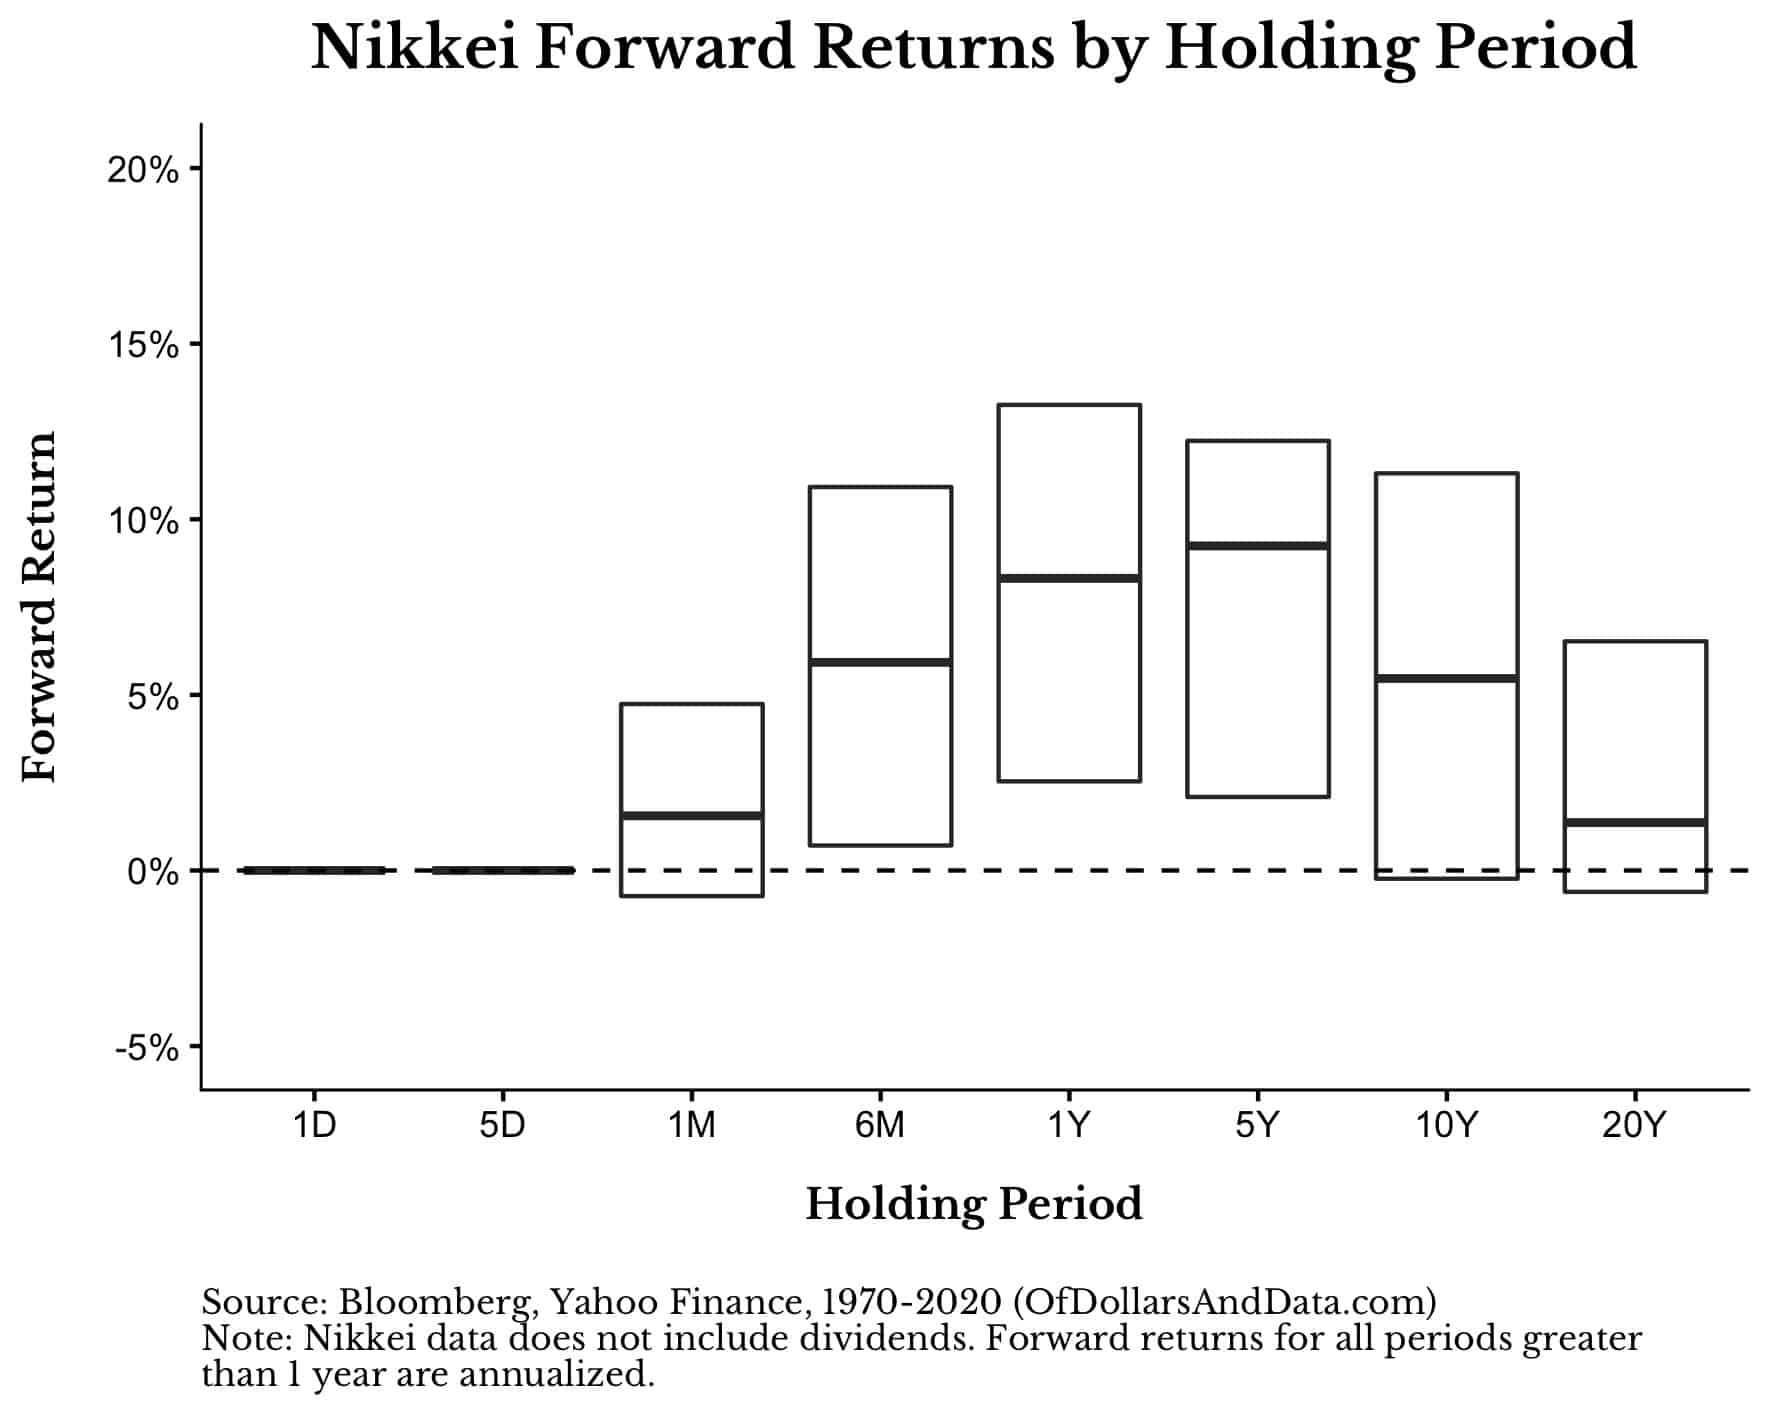
So even if you invested in one of the worst performing stock markets in the world over the last half century, you still would have made some money in a majority of all 10 and 20-year periods.
While this is nowhere near as impressive as the Dow-like roulette game imagined earlier, investing in Japanese stocks has had a positive expected value in most periods.
And if you examine a larger set of developed countries, you will see that nearly all of them returned between 3%-6% annually (on average) from 1900-2018, even when we adjust for inflation:
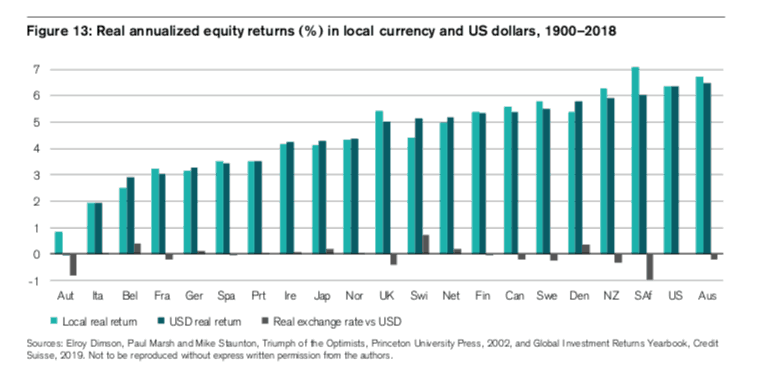
Yes, U.S. stock performance has been quite exceptional over the past century, but it hasn’t been the only positive expected value game in town.
Investors the world over have been compensated for playing this “new and improved” roulette game even if the details have varied by country. With that being said, there is only one question left to ask…
Would You Play?
With everything we have reviewed today, would you play the new roulette game we imagined?
If your goal is to make money, I think you would have to be crazy not to.
After all, where else can you find a game that will make you $0.05 a day (in expectation) for every $100 wagered? Where else can you earn $1 a month, or $12 a year, for every $100 at stake?
You might think 12% a year is high (it is), but these kinds of returns are not outside the realm of possibility.
For example, if I had invested $100 in the S&P 500 on the first day of my post-college career (7/16/2012), it would have grown to $246 by now:
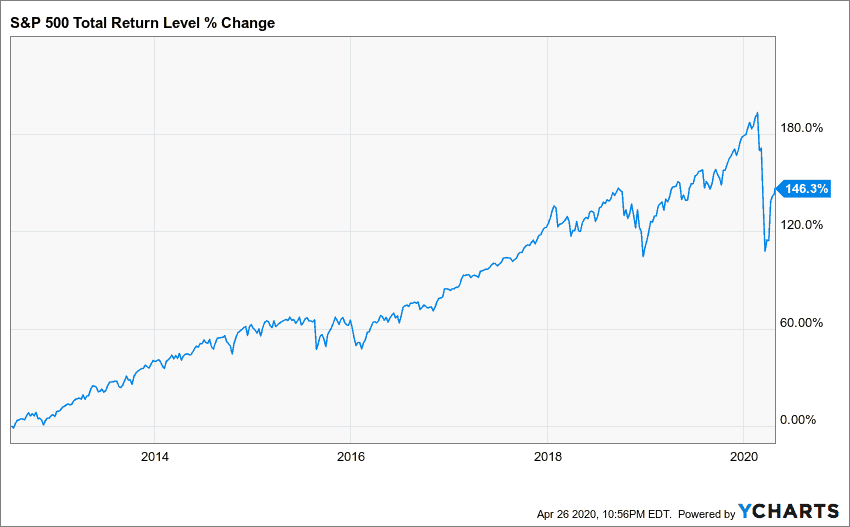
Over the past 8 years that is roughly a 12% annualized return, even with the recent coronavirus crash.
So, are you going to spin the wheel and collect your $0.05 a day? Your $1 a month? Your $12 a year?
Or are you gonna leave it for someone else?
Thank you for reading!
If you liked this post, consider signing up for my newsletter.
This is post 182. Any code I have related to this post can be found here with the same numbering: https://github.com/nmaggiulli/of-dollars-and-data

